T1 Weighted Sequence
The Common Vein
Copyright 2010
Introduction
Section Text

T1 Weighted Axial Images Overview |
|
These axial T1 weighted images taken sequentially fronm the vertex of the brain (top left) progressively through the forebrain and anterior cranial fossa, (approximately first two rows) through the midbrain (3rd row) and then hindbrain (posterior fossa)reveal the initial oval shape of the brain with progressive shortening in the AP projection to the butterfly shape of the cerebellum in the posterior fossa. Courtesy Philips Medical Systems 92127.8s |
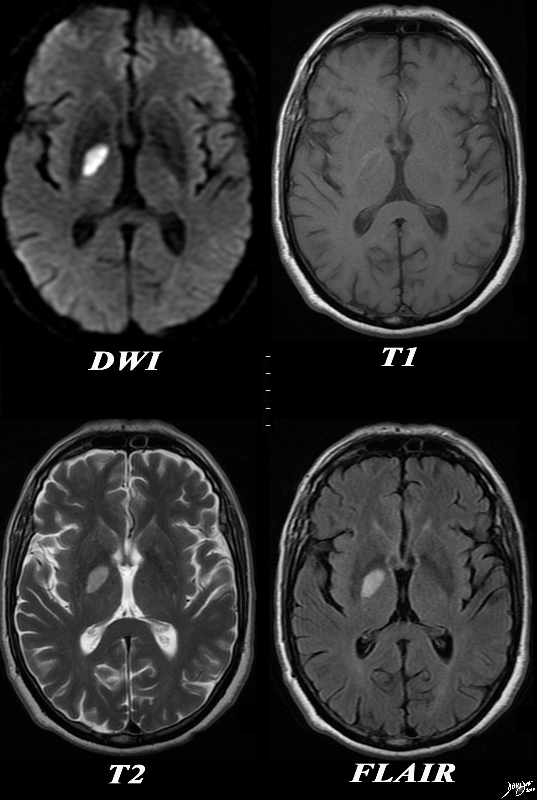
Acute Infarction Globus Pallidus with Rim Hemorrhage T1 Weighted Image the Clue to the Hemorrhage |
|
The basal ganglia with an abnormality in the right globus pallidus are shown in axial projection in the MRI of a 64 year old male who presents with acute neurological deficit. In the first image a high intensity region in the right globus pallidus is shown in axial projection on DWI consistent with an acute infarction. The second image is a T1 weighted image without contrast and shows a rim of high intensity suggesting rim hemorrhage.. The third T2 weighted image shows the lesion to be bright but not as bright as CSF a finding consistent with the acute infarction. The fourth image is a FLAIR image and also shows increased intensity of the lesion. The constellation of findings is consistent with an acute infarction of the right globus pallidus with a rim of acute hemorrhage. Courtesy Ashley Davidoff MD Copyright 2010 All rights reserved 89087c01.8s |
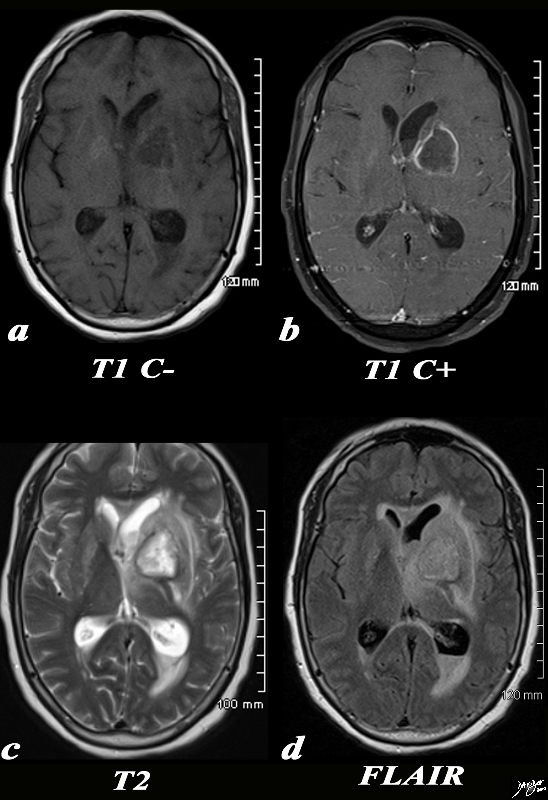
Importance of the I- to Characterize the I+ |
|
The basal ganglia in the region of the caudate nucleus and globus pallidus are shown in axial projection in this 60 year old female who presents with neurological deficit and a fever. In the first image the focal ill defined mass with mild mass effect is shown in axial projection on a T1 weighted image without contrast (a). The second image with gadolinium shows rim enhancement with mass effect and obstruction of the frontal horn as seen by asymmetric dilatation (b). The third T2 weighted image (c) shows the fluid nature of the cavity and the surrounding edema, mass effect, and accumulation of fluid in the dependant portion of the occipital horn. The fourth image is a FLAIR image and also shows th extent of the edema in the brain The patient had a fever and the constellation of findings were consistent with an abscess of the basal ganglia on the left. In this diagram the relationship of the basal ganglia to the ventricles is demonstrated. Courtesy Ashley Davidoff MD Copyright 2010 All rights reserved 89054c.8s |